New publication on Energy
|
|

Abstract
This paper introduces a framework for applying global parametric sensitivity analyses to energy system optimization models. The methodology presented is based on the optimal transport theory, enabling the identification of the most influential model inputs in shaping key outputs, such as energy mix composition, technology deployment, and system costs. The technique is applied to an instance for Italy within the Tools for Energy Model Optimization and Analysis energy planning tool. Algorithms devoted to managing inputs samplings, model runs and outputs postprocessing are developed and presented. Results are derived by exploring their dependency on the assumed energy scenarios and inputs variability. The findings of the paper show that demand levels and costs are the most influential inputs in business-as-usual scenarios, while techno-environmental constraints and efficiencies represent the most important inputs in decarbonization scenarios. Expanding input sampling ranges leads to the emergence of additional clusters of solutions, revealing alternative cost-optimal technology configurations and energy mixes that may not appear under narrower input variations. The proposed methodology helps in identifying parametrically the most impacting sources of uncertainty in energy planning and is openly available for future applications.
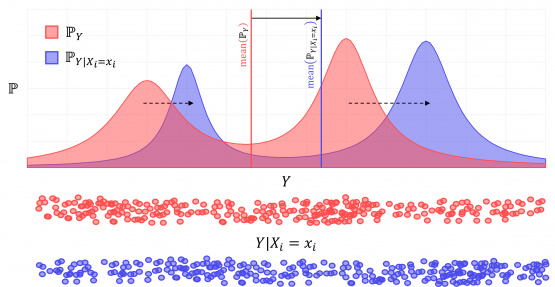
Fig. 3. Schematic representation of the optimal transport methodology concept for evaluating the influence of a single input in determining the probability distribution of a single output.
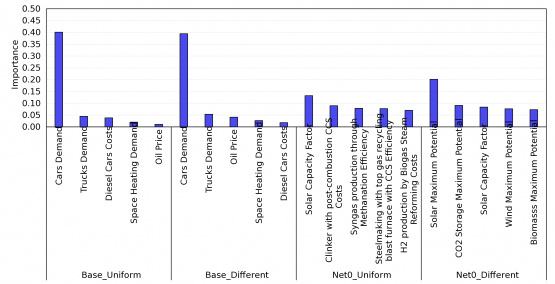
Fig. 8. Ranking and importance values of the five most important inputs in determining the model objective function taken as a single output in the four model configurations.
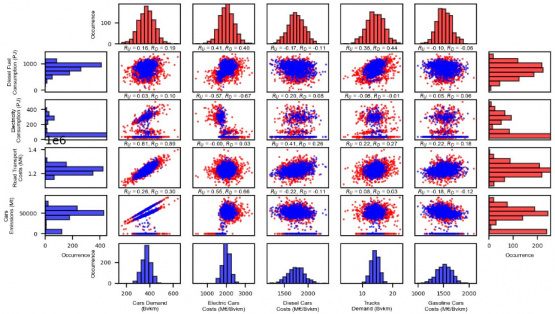
Fig. 13. Probability distributions of the five most important inputs for the transport sector, probability distributions for a selection of transport sector outputs and scatter plots and correlation coefficients ( for Base_Uniform, for Base_Different) for the couples of inputs and outputs in the Base_Uniform (blue items) and Base_Different (red items) samplings.